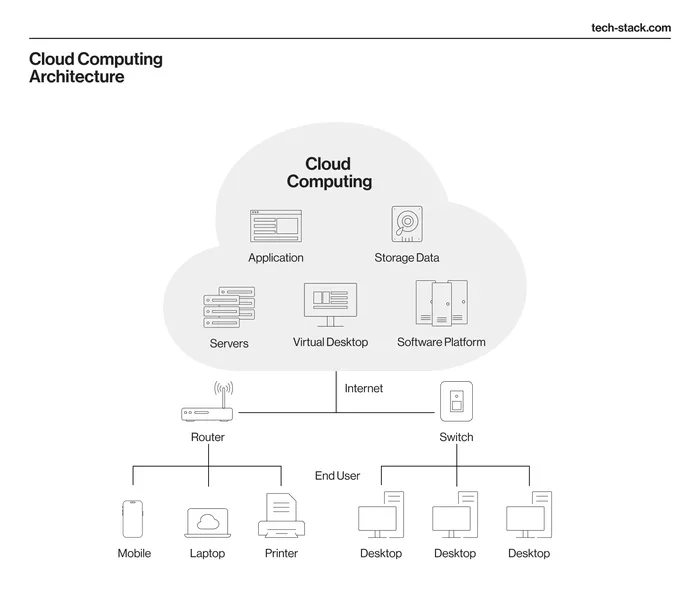
Cloud Computing Architecture Diagram Explained Simply
A cloud computing architecture diagram is a visual map that shows how cloud components work together. It helps teams plan, build, and manage cloud systems with ease. Understanding this diagram is essential for anyone involved in cloud design or IT infrastructure.
If you have ever wondered how companies run their entire operations on the internet, the answer lies in something called a cloud computing architecture diagram. Think of it as a blueprint. Just like an architect draws a plan before building a house, IT teams use a cloud architecture diagram to plan how data flows, where it lives, and how different pieces connect.
In simple terms, a cloud computing architecture diagram is a visual map of a cloud system. It shows servers, databases, networks, and applications all in one place. Whether you are a beginner or a seasoned IT pro, understanding this diagram can open doors to better cloud design and smarter decision-making.
This guide breaks everything down in plain language. You will learn what goes into a cloud architecture diagram, the different types you will see, and how to read one like a pro. Let us dive in.
Key Takeaways
- Visual Blueprint: A cloud computing architecture diagram gives you a clear picture of how all cloud pieces connect and communicate.
- Better Planning: It helps teams design systems that are scalable, secure, and cost-effective before writing a single line of code.
- Multiple Types Exist: From IaaS to hybrid cloud diagrams, each type serves a different purpose and audience.
- Easy to Learn: You do not need to be an expert to understand the basic components and symbols used in these diagrams.
- Saves Time and Money: A well-drawn diagram reduces errors, speeds up deployment, and improves team collaboration.
- Security Matters: Good diagrams include security layers like firewalls, encryption, and access controls.
📑 Table of Contents
- What Is a Cloud Computing Architecture Diagram?
- Key Components of a Cloud Architecture Diagram
- Types of Cloud Computing Architecture Diagrams
- How to Read a Cloud Computing Architecture Diagram
- Benefits of Using a Cloud Computing Architecture Diagram
- Best Practices for Creating a Cloud Architecture Diagram
- Popular Tools for Drawing Cloud Architecture Diagrams
- Conclusion
What Is a Cloud Computing Architecture Diagram?
A cloud computing architecture diagram is a visual representation of a cloud-based system. It uses standard symbols and shapes to show how components like servers, storage, databases, and networks interact. The goal is to make complex systems easy to understand at a glance.
Imagine you are looking at a map of a city. You see roads, buildings, and landmarks. A cloud diagram works the same way. It maps out the digital landscape so teams can see the big picture. You do not need to dig into code to understand what is happening.
These diagrams are used by cloud architects, developers, network engineers, and business stakeholders. Each group uses the diagram for a different reason. Architects design the system. Developers build it. Business leaders review it to understand costs and risks. Everyone benefits from a clear visual.
Why Do You Need One?
Without a diagram, cloud systems can become a tangled mess. Teams lose track of how data moves between services. Security gaps appear. Scaling becomes a guessing game. A cloud computing architecture diagram solves all of these problems.
It gives your team a single source of truth. When everyone looks at the same diagram, miscommunication drops. Decisions become faster. And when something goes wrong, you can trace the issue back to its source much more easily.
Key Components of a Cloud Architecture Diagram
Every cloud computing architecture diagram contains a set of standard components. These building blocks represent real-world elements of a cloud system. Let us break them down one by one.
Compute Resources
Compute resources are the brains of the cloud. They process data and run applications. In a diagram, you will often see icons for virtual machines, containers, or serverless functions. These represent the cloud computing layers where actual work gets done.
For example, Amazon Web Services uses the term EC2 for its virtual machines. Microsoft Azure calls them Virtual Machines. Google Cloud uses Compute Engine. Each provider has its own naming, but the concept is the same.
Storage
Storage components hold your data. This includes object storage, block storage, and file storage. In a cloud infrastructure diagram, storage is often shown as a cylinder or a stack of boxes.
Common examples include Amazon S3 for object storage and Azure Blob Storage. These services let you store huge amounts of data without managing physical hard drives. That is the beauty of cloud storage in a diagram.
Networking
Networking connects everything together. It includes virtual private clouds, subnets, load balancers, and firewalls. In a network architecture diagram, you will see arrows showing data flow between components.
A load balancer distributes traffic across multiple servers. This keeps your application fast and available. Firewalls protect your system from unauthorized access. Together, these networking pieces form the backbone of any cloud setup.
Databases
Databases store structured data. In a cloud diagram, you might see relational databases like Amazon RDS or NoSQL databases like DynamoDB. The database component is critical because it holds the information your applications need to function.
Security Layers
Security should never be an afterthought. A good cloud computing architecture diagram includes identity and access management, encryption, and monitoring tools. These layers show how data stays safe from start to finish.
Look for symbols representing firewalls, VPNs, and key management services. Each one plays a role in protecting your cloud environment from threats.
Types of Cloud Computing Architecture Diagrams
Not all cloud diagrams look the same. Different types serve different purposes. Let us explore the most common ones you will encounter.
Logical Architecture Diagram
A logical diagram shows how the system works at a high level. It focuses on components and their relationships. You do not see physical details like server names or IP addresses. Instead, you see groups and services.
This type of diagram is great for explaining a system to non-technical stakeholders. Business managers and clients can easily understand it. It answers the question: “How does this system work?”
Physical Architecture Diagram
A physical diagram shows the actual hardware and infrastructure. It includes specific servers, data centers, and network devices. This diagram is more technical and is usually used by DevOps teams and infrastructure engineers.
While it is more detailed, a physical cloud computing architecture diagram can be harder to read for beginners. Reserve it for technical audiences who need exact specifications.
Deployment Architecture Diagram
This diagram shows how applications are deployed across the cloud. It includes details about environments like development, staging, and production. You will see how code moves from one stage to the next.
Deployment diagrams are especially useful in CI/CD pipelines. They help teams understand their release process and spot bottlenecks early.
Hybrid and Multi-Cloud Diagrams
Many businesses use more than one cloud provider. A hybrid cloud architecture diagram shows how on-premise systems connect with public cloud services. A multi-cloud diagram maps out two or more public clouds working together.
These diagrams are more complex, but they are increasingly common. Companies use them to avoid vendor lock-in and improve redundancy.
How to Read a Cloud Computing Architecture Diagram
Reading a cloud computing architecture diagram might seem intimidating at first. But once you know the basics, it becomes second nature. Here is a simple step-by-step approach.
Step 1: Identify the Boundary
Every diagram has a boundary that separates the system from the outside world. Look for a box or a shaded area. Inside that box is your system. Outside is everything else.
Step 2: Find the Main Components
Scan the diagram for familiar shapes. Servers look like boxes. Databases look like cylinders. Load balancers look like arrows or circles. Once you identify these, you have a roadmap.
Step 3: Follow the Data Flow
Look at the arrows. They show how data moves from one component to another. Start at the user entry point and trace the path. This tells you the order of operations.
Step 4: Check for Security Elements
Look for icons representing firewalls, encryption, and identity services. These tell you how the system protects data. A well-designed diagram makes security visible and easy to review.
Quick Tips for Reading Diagrams
- Do not get overwhelmed by details. Start with the big picture.
- Use the diagram legend if one is provided.
- Ask questions if you are unsure about a component.
- Compare the diagram to real-world use cases for better understanding.
- Look for color coding, which often indicates different environments or tiers.
Benefits of Using a Cloud Computing Architecture Diagram
Creating a cloud computing architecture diagram offers many real-world benefits. Let us look at why so many teams rely on them.
Improved Communication
Diagrams bridge the gap between technical and non-technical teams. When everyone can see the same picture, misunderstandings drop. Developers, managers, and clients all speak the same visual language.
Better Planning and Design
Before you spend money building a cloud system, a diagram helps you plan. You can spot potential issues early. You can test different layouts without any cost. This saves both time and money.
Easier Troubleshooting
When something breaks, a diagram helps you find the root cause faster. You can trace the data flow and identify where the problem started. This reduces downtime and frustration.
Scalability and Growth
A good diagram shows how your system can grow. You can see where to add more servers, storage, or services. This makes cloud scalability much easier to plan for.
Documentation and Compliance
Many industries require detailed documentation of IT systems. A cloud infrastructure diagram serves as official documentation. It helps with audits and compliance checks.
Best Practices for Creating a Cloud Architecture Diagram
Creating a great cloud computing architecture diagram takes some thought. Follow these best practices to make your diagrams clear and useful.
Keep It Simple
Do not try to show every single detail. Focus on what matters most. A cluttered diagram confuses more than it helps. Start simple and add detail only when needed.
Use Standard Symbols
Stick to widely recognized symbols. Most teams use standard icons for servers, databases, and networks. Using non-standard shapes will confuse your readers.
Label Everything Clearly
Every component should have a clear label. Do not rely on colors alone. Some people cannot distinguish certain colors. Text labels make your diagram accessible to everyone.
Include a Legend
A legend explains what each symbol means. It is a small addition that makes a big difference. Anyone new to the diagram can pick it up quickly.
Update Regularly
Cloud systems change constantly. Your diagram should reflect the current state of the system. An outdated diagram is worse than no diagram at all. Make updating part of your regular workflow.
Common Mistakes to Avoid
- Overcomplicating the diagram: Too many details make it unreadable.
- Skipping the legend: Readers will guess what symbols mean.
- Ignoring security components: Security should always be visible.
- Using vague labels: “Server 1” tells us nothing. Use meaningful names.
- Forgetting to update: A stale diagram leads to bad decisions.
Expert Insights
“A cloud architecture diagram is not just a technical artifact. It is a communication tool. The best diagrams tell a story about how a system works and why it was designed that way.” — This is a common view among experienced cloud architects. They know that a diagram serves both technical and business purposes.
When you create a cloud computing architecture diagram, always think about your audience. A developer needs different details than a business stakeholder. Tailoring your diagram makes it far more effective.
Popular Tools for Drawing Cloud Architecture Diagrams
You do not need to draw diagrams by hand. Many tools make the process fast and easy. Here are some popular options.
- Lucidchart: A web-based tool with cloud-specific templates. It is user-friendly and great for teams.
- Draw.io (diagrams.net): A free, open-source option that integrates with Google Drive and Confluence.
- Microsoft Visio: A classic diagramming tool with extensive shape libraries.
- AWS Architecture Center: Offers free templates specifically for AWS cloud designs.
- Excalidraw: A simple, whiteboard-style tool perfect for quick sketches.
Each tool has its strengths. Choose one that fits your team’s workflow and budget. The goal is to make diagram creation fast and collaborative.
Conclusion
A cloud computing architecture diagram is one of the most valuable tools in modern IT. It turns complex cloud systems into clear, visual stories. Whether you are designing a new system or troubleshooting an existing one, a well-crafted diagram makes all the difference.
Start by understanding the basic components. Practice reading different types of diagrams. Use the best practices shared in this guide. Over time, you will find that cloud diagrams become an essential part of your workflow. They save time, reduce errors, and bring teams together.
The cloud world moves fast. But with the right diagram in hand, you can keep up and stay ahead. Take what you have learned here and start applying it today. Your future self will thank you.
Frequently Asked Questions
What is a cloud computing architecture diagram used for?
A cloud computing architecture diagram is used to visually map out how cloud components like servers, databases, and networks connect. It helps teams plan, build, and troubleshoot cloud systems more effectively.
Do I need to be a technical expert to read a cloud architecture diagram?
No. While some diagrams are technical, many use simple symbols that anyone can understand. Logical diagrams in particular are designed for non-technical audiences and business stakeholders.
What are the main types of cloud architecture diagrams?
The main types include logical diagrams, physical diagrams, deployment diagrams, and hybrid or multi-cloud diagrams. Each type serves a different purpose and audience.
Which tools are best for creating a cloud computing architecture diagram?
Popular tools include Lucidchart, Draw.io, Microsoft Visio, and AWS Architecture Center templates. Choose one based on your team’s needs and budget.
How often should I update my cloud architecture diagram?
You should update your diagram whenever the cloud system changes. Regular updates ensure the diagram remains accurate and useful for troubleshooting and planning.
Is a cloud architecture diagram the same as a network diagram?
Not exactly. A network diagram focuses on network connections and devices. A cloud computing architecture diagram covers a broader view, including compute, storage, databases, and security layers.